
MindChamp offers credible, future-ready coding education built by IIT and NYU alumni. Its curriculum is authored by the team behind Collins Smart Tech textbooks (Classes 1–8), used in 100 schools, and is aligned with NEP 2020. Designed for ages 7–18, it follows a structured progression from block coding to Python, AI, app, and web development, delivered through hands-on, project-based learning. With experienced IT/CS mentors, small batches, MindChamp Lab access, impact reports, and students from 12+ countries, MindChamp blends academic rigour with real-world relevance and proven outcomes since 2016.

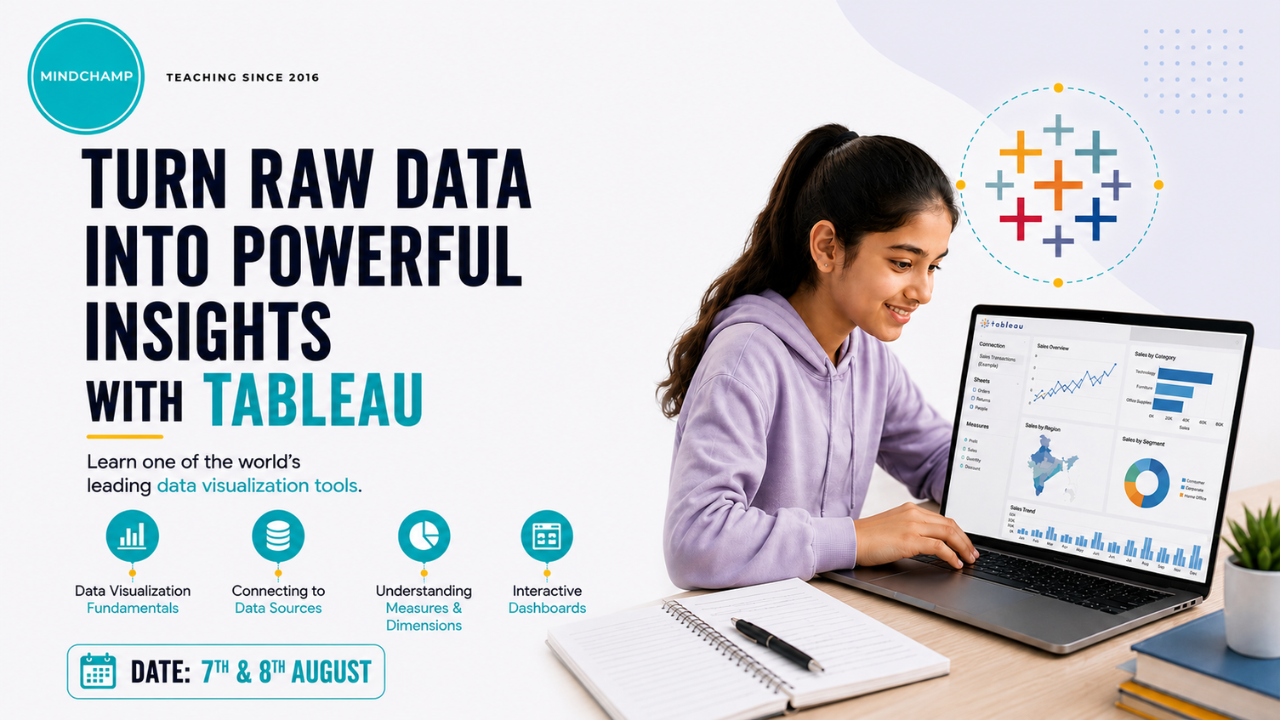

Tableau Workshop | Data Visualization & Dashboarding
Where Young Coders Become Future Tech Leaders
About the Workshop
Raw data is only useful once someone can make sense of it — and Tableau is one of the most in-demand tools for doing exactly that. This beginner-friendly workshop takes participants from the fundamentals of data visualization to building fully interactive dashboards, through hands-on exercises and practical demonstrations. No prior Tableau experience needed — just basic familiarity with Excel.
What to Expect
- Instructor-led sessions covering data visualization fundamentals and connecting to data sources.
- Hands-on practice creating charts, graphs, and interactive dashboards.
- Guidance on measures, dimensions, and choosing the right chart type for your data.
- Dashboard design best practices, including filters and interactive actions.
- An interactive Q&A to address specific questions and use cases.
Who Is It For
- Beginners interested in learning Tableau, no prior experience required.
- Anyone looking to build foundational data visualization skills.
Prerequisites
- Basic knowledge of Microsoft Excel.
- No prior Tableau experience needed.
Why Attend?
- Learn a highly in-demand data visualization tool from the ground up.
- Build real dashboards through hands-on exercises, not just theory.
- Walk away with skills directly applicable to reporting and analysis roles.
- Understand best practices for presenting data clearly and effectively.
About MindChamp

MindChamp
